


By Arnout Schutte, Co-founder / Managing Director
PIM KPIs: why you are measuring the wrong metrics.
Many organisations believe they are measuring their PIM system effectively. They monitor data quality, track time to market, and keep a close eye on conversion rates and the customer experience. On paper, this makes perfect sense, and these are often the metrics discussed in the boardroom. Yet, a fundamental misconception lies beneath the surface, and you can only resolve it by gaining true Control over product data.
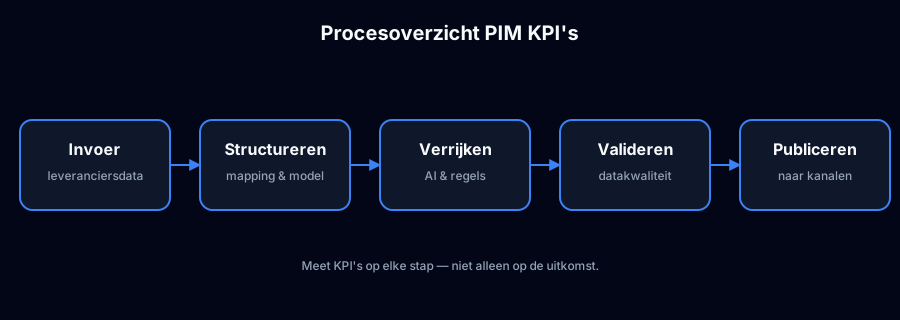 Process overview of PIM KPIs: input, structuring, enrichment, validation, and publishing
The problem is not in your product data.
Most discussions regarding a Product Information Management system start with the data itself. Is it complete? Is the structure sound? Are the attributes correctly populated? However, that is rarely where the actual friction lies.
The real problem lies in the work required to get the data to that state.
Suppliers provide data in varying formats: often incomplete and rarely consistent. Teams spend hours cleaning this data, mapping it to the correct Data Model & Structure, and filling in missing information. This is followed by a cycle of checking, correcting, and re-publishing.
When organisations see their KPIs improve, it is often because more time and human capacity have been poured into the process. The PIM system hasn't taken over the workload: people are simply organising the chaos better.
That isn't a structural solution; it is merely the optimisation of inefficiency.
Why KPIs within a traditional PIM system fall short.
The way KPIs are traditionally configured within a PIM system usually stems from an outdated premise: the PIM is seen as a management tool where data is stored, checked, and adjusted manually.
Consequently, organisations primarily measure output. They look at data completeness, how fast products go live, and error rates. What is usually missing is visibility into how much manual effort was required to achieve that result.
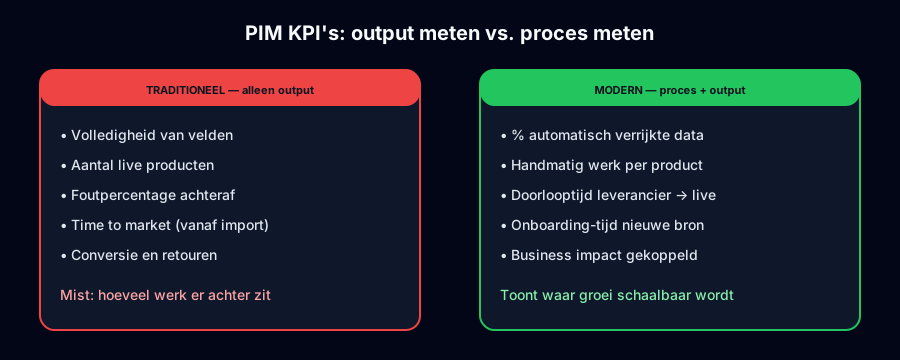 PIM KPIs compared: traditional output metrics versus modern process metrics
And that is precisely where the greatest cost lies within a PIM system.
As long as manual work persists, the dependency on individuals remains. This limits your speed, scalability, and overall quality.
The shift: PIM as a process, not a tool.
A fundamental shift is taking place: Product Information Management is no longer viewed as a static database where data is managed, but as a continuous process where data evolves and flows.
Product data enters, is structured, enriched, and validated, and then flows to every required sales channel. This should not be a series of disconnected manual steps, but a cohesive and largely automated process.
When you approach PIM this way, the way you measure success changes. It is no longer just about the quality of the output, but about how efficiently and predictably the process itself runs.
The most important KPIs for a modern PIM system.
1. Data quality without manual work
Data quality is a key indicator, but completeness and consistency only tell half the story. The crucial question is: how much effort is required to reach that level?
If your teams are constantly correcting and supplementing data, then quality is the result of human effort, not the PIM system. In this scenario, you do not have a scalable process.
Forward-thinking organisations measure what percentage of data is automatically enriched and immediately usable. International standards like GS1 and ETIM International help make this quality objectively measurable.
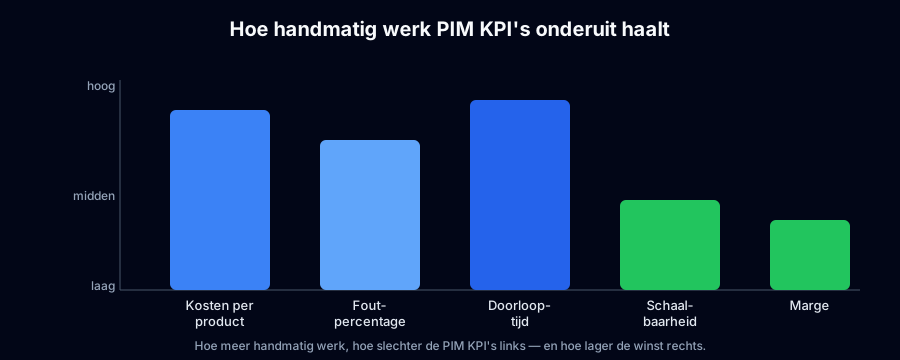 Impact of manual work on PIM KPIs such as costs, errors, lead time, and scalability
2. Time to market without hidden delays
Time to market is often measured from the moment a product enters the PIM to the moment it goes live. This ignores a significant portion of the process.
The greatest delay occurs when raw supplier data is converted into usable product information. This is where manual steps and bottlenecks are most frequent.
By including this phase in your measurements, you gain true visibility into the actual speed of your product data flow.
3. The volume of manual work
One of the most underestimated PIM KPIs is the amount of manual work per product. This has a direct impact on costs, speed, and scalability.
Every manual action adds time, introduces the risk of error, and limits your ability to scale without increasing headcount. Making this metric visible provides a realistic picture of how efficiently your PIM is actually functioning.
4. Product onboarding efficiency
Onboarding new products and suppliers is a recurring bottleneck. Varying data standards and missing information mean onboarding often takes longer than expected. With upcoming EU regulations like the Digital Product Passport (ESPR), this pressure will only intensify.
In traditional systems, the work only begins after the data has been imported. By viewing Import & Onboarding as an automated process that starts before the data enters the PIM, you transform the role of your team from data cleaners to data managers.
5. Commercial impact and business results
Ultimately, PIM is about commercial impact. Better product data leads to higher conversion, fewer returns, and a superior customer experience.
However, these KPIs only show the final result. By linking business outcomes to process KPIs, you gain a complete picture of the true impact of your Product Information Management strategy.
Why are many PIM KPIs ineffective?
Many PIM KPIs focus too heavily on quantitative metrics, such as the number of fields completed, without measuring the qualitative impact or the manual effort involved. This creates a misleading picture of the actual value and efficiency of the product information process.
Which PIM KPIs should I target for e-commerce?
For e-commerce, prioritise KPIs with a direct impact on sales: conversion rates, return rates, time to market for new products, and cost savings through error reduction. Compliance with standards like GS1 and readiness for the Digital Product Passport are also critical.
How does ConnectingTheDots help with relevant PIM KPIs?
ConnectingTheDots provides a platform that ensures data quality and consistency, contributing directly to better business results. Through features like Import & Onboarding and automated Workflows & AI, we help you move away from manual tasks and focus on qualitative KPIs that drive growth.
The key question for any PIM system.
When you boil all KPIs down to their core, one guiding question remains:
How much manual work is still required within your PIM process?
This answer determines whether your organisation is truly scalable, or whether growth will inevitably lead to increased complexity and spiralling costs.
Why this is becoming more important.
Product data is becoming increasingly complex. Organisations are managing more products, more variants, and more channels than ever before. Simultaneously, the number of suppliers is growing, bringing a wider variation in data quality.
Without a PIM system that evolves with these changes, growth leads to more manual tasks, more errors, and longer lead times. In this scenario, the team isn't supported by the system: the team becomes the bottleneck.
Conclusion: get more out of your PIM by measuring differently.
Many organisations still treat their PIM as a simple management tool. As a result, the real problem remains hidden: the sheer amount of work required to make product data usable.
As long as that manual burden exists, you will face limitations in speed, scalability, and cost control. The question is not just whether your PIM functions, but how much effort is required to keep it running.
If you want visibility into how your Product Information Management system actually performs, we can help you map it out. In a short session, we can identify where friction exists in your process and what steps are needed to structurally remove it.
More about PIM KPIs
In practice, effective PIM KPIs demonstrate how product data becomes available faster and more consistently across every channel.